Impact Lvl 1:
Last modified: October 04, 2015
Highlights
I am aware that the various anchor initiatives in Rochester have similar goals and that the organizations/teams driving these initiatives have great intention to collaborate. I am also familiar with the difficulty of teaming and collaboration. That's why alignment of goals, indicators, strategies and measurements is highly valued in best-practices such as Lean 6 Sigma. While leaders of the various organizations and projects have publicly declared their commitment and intentions to collaborate and to align goals, efforts and measurements. Beyond the rhetoric, where is the "beef"?
Contents
Community dashboard gaining momentum but ..
I am aware that various anchor initiatives (DMC, J2G, CHNA, Housing, Transportation) in Rochester have similar goals and that the organizations/teams driving these initiatives have great intention to collaborate. I am also familiar with the difficulty of teaming and collaboration. That's why alignment of goals, indicators, strategies and measurements is highly valued in best-practices such as Lean 6 Sigma. While leaders of the various organizations and projects have publicly declared their commitment and intentions to collaborate and to align goals, efforts and measurements.
Beyond the rhetoric, where is the "beef"?
A credible confirmation of this is for these leaders to agree on a common set of measurements. What are the "Top 5" metrics that we are committed to monitor as indicators that the initiatives/programs/projects are making progress towards stated DMC goals?
While goals like Livable City, Health & Wellness, Learning Environment expressed in early DMC concept briefings are perhaps nebulous and subject to debating as to what indicators are meaningful to reflect their progress, indicators such as job growth (at least 35,000 new jobs) and increased tax revenue ($7 billion) are obvious.
The question is then how are we measuring these clear-cut indicators? What is the base-line?
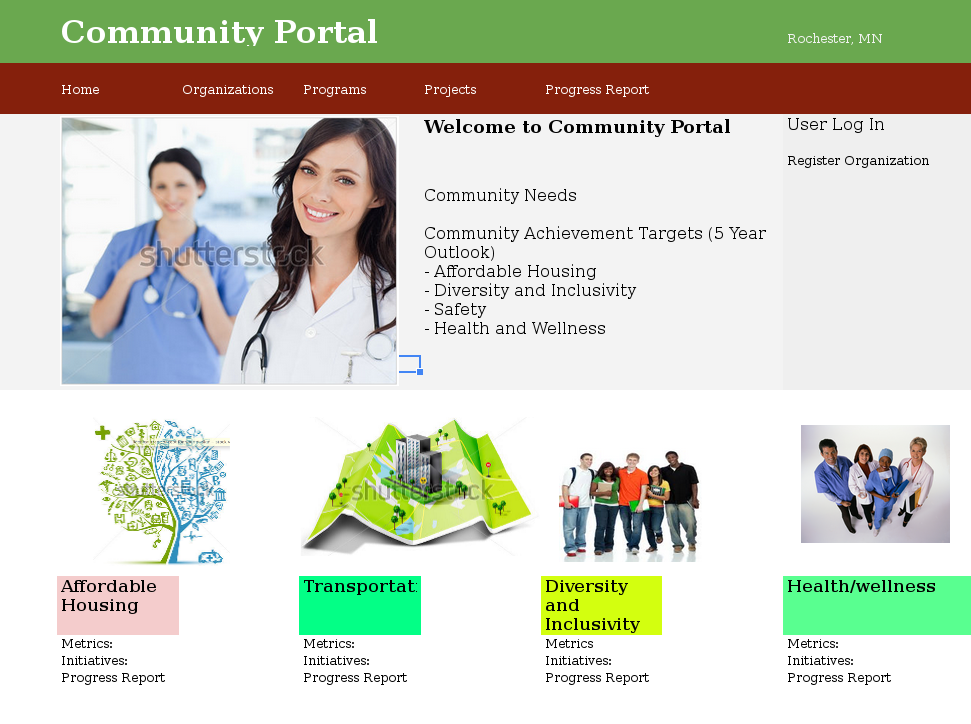
Wouldn't it be nice to have a community dashboard to show the "Job" and "Revenue" trends? And other indicators could be "Affordable Housing", "Transportation".
The September 23 CNG meeting with Minnesota Compass is a good start. The necessary next step is to have buy-in and active sponsor ship from community leaders. MN Compass have organizations like 3M Foundation, Bush Foundation, etc. fund their effort and lend support and legitimacy. And they had conveners for various advisory groups such as Eduction: Alice Segren, Commissioner, Minnesota Department of Education, Housing: Time Marx, Commissioner, Minnesota Housing.
To make it real for Rochester, we need to find local sponsorships and conveners of equivalent stature and community standing. That is above my pay grid.
In the meantime, I will continue to work my "home-brewed" dashboard.
Related Reports
Other Community Dashboard Pinned Reports
May 21, 2016 : Community Beam presentations
Impact Lvl1: Best Practice, Business Process, Technology Enablement, Workforce Development
Impact Lvl2:
Back To Top
Pinned openBEAM.net organization and project reports
.
Project Report of Maintain and Evolve the 2016 Rochester/Olmsted County Compass Points (Community Dashboard) :
March 10, 2024 : DMC Dashboard Metrics Portal
Impact Lvl1: Metrics
Impact Lvl2:
Project Report of Maintain and Evolve the 2016 Rochester/Olmsted County Compass Points (Community Dashboard) :
April 27, 2021 : Minnesota Compass
Impact Lvl1: Education, Metrics, OpenBeam, Public Safety, Technology Enablement
Impact Lvl2:
Project Report of Maintain and Evolve the 2016 Rochester/Olmsted County Compass Points (Community Dashboard) :
May 08, 2018 : CNG Steering Committee working on 2018 Compass Points
Impact Lvl1: Basic Needs, Best Practice, Caring Relationship, Children & Youth, Diversity and Inclusion, Housing, Metrics, Public Safety, Sustainability, Transportation, Workforce Development
Impact Lvl2:
Project Report of Maintain and Evolve the 2016 Rochester/Olmsted County Compass Points (Community Dashboard) :
October 30, 2016 : CNG Releases Compass Points 2016, City of Rochester and Olmsted County
Impact Lvl1: Best Practice, Business Process, Children & Youth, Diversity and Inclusion, Economic Development, Health, Housing, Income, Public Safety, Sustainability, Technology Enablement, Transportation, Workforce Development
Impact Lvl2:
Project Report of Community Dashboard :
May 21, 2016 : Community Beam presentations
Impact Lvl1: Best Practice, Business Process, Technology Enablement, Workforce Development
Impact Lvl2:
Project Report of Maintain and Evolve the 2016 Rochester/Olmsted County Compass Points (Community Dashboard) :
February 24, 2016 : Community Dashboard - CNG coodintating funding request to build Community Dashboard.
Impact Lvl1: Aging, Best Practice, Diversity and Inclusion, Economic Development, Technology Enablement
Impact Lvl2:
Back To Top
